In Hammer of Math we cover key topics in statistics, probability, and math for tabletop wargames.
As we gear up this week for the release of a new dataslate for Warhammer 40k, we thought it would be a good time to sit down and look at the state of the meta and determine which factions are likely to get hit, and the stats which might drive some of those decisions. As part of that, we’ll look at some of the stats we use to determine faction strength here at Goonhammer, and how we go beyond Win Rates when we think about faction strength and tiering.
The stats we’ll be talking about in this article come from and are show on our stats site, 40kstats.com, and we’ll also be talking about a few stats from Stat Check.
Win Rate
One of the three most important stats for determining a faction’s strength is its overall win rate, defined as the percentage of games won by the faction, i.e. wins divided by games played. There are a few things we want to do when we calculate win rate, and the most important of these is to remove mirror match games, which tend to push the faction’s win rate closer to 50%, so removing those games gives us something more akin to a “true” win rate.
Error Bars and Significance Testing
One of the common things you’ll see mentioned when talking about win rates in Warhammer 40k is that win rates between 45 and 55 percent are considered “fine.” But why is that?
Well, there are two reasons. The first is that a pure 50% win rate for 30 asymmetrical factions is impossible. The other is statistical significance. In an ideal world with true balance between factions, each faction would, over thousands of games, win 50% of its games. But we know things aren’t so balanced, and even if they were, there are plenty of factors that can swing a game, such as dice rolls, terrain, or the mission. If you’re flipping a coin and tracking heads vs. tails results, at any given point you may have an imbalance between them as you get a long run of one result. in the long run, they’ll regress to the mean but the third time (and every odd numbered time, generally) you flip that coin, you’re guaranteed an uneven result.
Likewise, variance abounds in 40k. Over a large sample of games win rates across factions will even out and true-r win rates will emerge but we can use statistical testing to determine the likelihood that any win rate we got is likely to be different from a 50% win rate. We do this with a Significance test for a proportion. Specifically, we’re testing the theory that a faction’s win rate is significantly different from our baseline rate (50%). We’ll call this idea our Null Hypothesis, and test against that by calculating a test statistic, or z in the formula below:
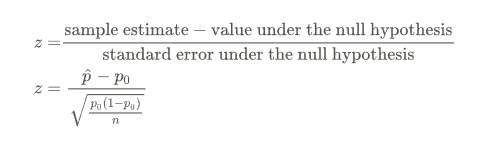
Because wins and losses are a binomial outcome, we can use the binomial distribution for our standard error calculation. Once we have our test statistic, we can use that to determine if say, a faction’s win rate or a go-first win rate is really not 50%, or if the observed win rate is likely just the result of random factors – and presumably will level out over time/more games. If the test statistic is sufficiently large, i.e. well outside the expected variance for the statistic we’re comparing it to given the sample size, then we can comfortably say (or with some confidence level), that it is statistically significant and refute the null hypothesis, or the idea that the faction’s win rate is actually 50% in this case.
As an example, let’s look at the win rates for Thousand Sons. We’ve currently had just under 100 thousand Pariah Nexus games logged in Tabletop Battles, giving us 4,813 games for Thousand Sons with a win rate of 53.9%. In Stat-Check, that number is higher for the GT dataset, with 2,272 games played and a 57% win rate. Not a huge difference, but both are worth checking. If we run the numbers on our 40kstats win rate, we get:
z = (0.539 – 0.5) / sqrt((0.5*(1-0.5))/4813) = 5.41
Because we don’t care about the direction of the difference in our win rates – going over or under 50% by a significant amount is fine, we’re running a two-tailed test, and we can use our z score to generate a p-value. This is used to determine whether our result is significant at a given level – the higher the level of confidence we need, the higher the value our z-score needs to be for us to reject the null hypothesis (that our win rate is actually just 50% and we’re observing a temporary random deviation from that). For a 95% confidence level, that z-score needs to be greater than 1.96 or less than -1.96. 5.41 fits the bill, so we can confidently confirm that the win rate for Thousand Sons is significantly higher than 50%, and our 53.9% result is accurate.
Let’s do a similar check against the Stat-Check number:
z = (0.57 – 0.5) / sqrt((0.5*(1-0.5))/2272) = 5.57
This is also well above what we need for our significance test, and so we can conclude that yeah, the Stat-Check result for Thousand Sons is also significantly higher than 50%.
OK, but are those two results significantly different from each other? Well, there’s a third test we can run, to compare two sample proportions:

where p1 and p2 are observed proportions in each sample, and n1 and n2 are sample sizes. We’re using pooled sample proportions here, so our p0 is going to be the averaged win rate across both samples, or 0.55.
This gives us:
z = (0.539 – 0.57) / sqrt(0.55*(1-0.55)*(1/4813 + 1/2272)) = 5.53
This is also significant – mostly thanks to our large sample sizes – telling us that the results the Thousand Sons see at higher levels of play are significantly different from those across a broader sample – tournament players are winning at a slightly higher rate across the board when they pick up Thousand Sons. That’s an important factor here – we can tell that when serious play happens, Thousand Sons are stepping up and doing even better in experienced hands.
That said, it’s worth noting that at these sample sizes – thousands of games, even small differences in win percentage are going to be significant – the bigger your sample, the smaller that denominator gets, and the larger your test value will be.
Win Rate is an important part of the balancing story, but it’s not the whole story – it is, after all, an aggregated metric which ignores player skill and the quality of games – not all games are created equal, and at higher levels of play we may see different results. Which brings us to…
Tournaments in Winning Position (TiWP) %
The next stat we want to look at is around tournament performance – specifically, how often do players of these armies get off to a good enough start to be in position to win an event? Here we define that as any player who started an event 4-0 or better. Why 4-0? Two reasons – the first is that this is the point at which you are going to make the top 4 cut of a 6-round event, or be in the finals of a 5-round event, and also this is when cutoffs are made for the GW US Open events and other 8-round events using a cutoff system to determine a top 16. We call this statistic Tournaments in Winning Position, or TiWP.
How do we use this statistic? Well, in its base form, TiWP is a counting stat, and so we need to do some work with it. Hey, while we’re on that topic, let’s talk about…
Counting Stats vs. Rate Stats
There are two common types of statistic you’ll see used in the analysis of games and sports:
- Counting Statistics are stats which count some result as a total, such as the total number events won by a faction, the number of Home Runs a player hit in a season, or the number of yards a player rushed for. These statistics are useful when you have a normalized or regular time frame to look at, such as a single season of play, one tournament, or even a single game. In those cases they provide useful frames of comparison. However, when you change those parameters, or they can vary, counting statistics become pretty meaningless – if you increase the length of a baseball season you’d expect players to score more home runs as they have more opportunities, and so comparing counting stats across seasons of variable length becomes impossible. Likewise, TiWP will naturally be skewed by factions which have more players – those factions have more chances to win events, and naturally we’d expect their raw TiWP totals to be higher.
- Rate Statistics are statistics which measure the rate at which something occurs, normalizing it over a population or period of time. This is a powerful improvement, and helpful for providing context – if you look at New York City crime statistics, there were 386 murders in 2023 (an 11% decrease from 2022). In comparison, St. Louis had 158 after a 21% reduction from 2022 (murders in the US was down nearly 12% nationwide in 2023, so good job, America). So St. Louis seems like a safer city than New York, right? Well, New York has a population of 8.336 million compared to only 286,578 for St. Louis, meaning the murder rates for each city are substantially different – if you divide those numbers by the population count of each city, you get a number that’s nearly 12x higher for St. Louis, suggesting that murders happen in the city much more often – and that also reflects that New York has a murders per capita below the national average (5.5 per 1000 people) compared to St. Louis.
Grim stuff, but let’s bring it back to fictional tabletop murders. When it comes to TiWP, we want to normalize this statistic based on the number of players who bring that army to an event. So the next step is to look at Faction Representation, or the percentage of players who play that faction at events (Stat-Check refers to this as Player Population). With 27 factions available in competitive 40k, give or take – we can exclude Imperial Agents and just look at 26, if we’re being honest – each faction should show up 3.8% of the time. Anything significantly over that, and the faction is over-represented; anything under, and it’s under-represented (and yes, we can significance test this percentage, but it’s not super important to do that in this context).
Coming up with the Denominator
Alright so we have our TiWP count and our faction representation percentage. How do we use these to create a new, useful statistic? Well, TiWP can be converted into a percentage by turning it from a counting stat into a share, i.e. “what percentage (or share) of the available TiWPs did a faction claim?” If an event had 8 players start 4-0 and collect a TiWP, and four of those players were playing space marines, then they accounted for 50% of the available TiWP slots.
TiWP Ratio
Alright, now we have something we can work with – we know the share of TiWP opportunities a faction scored, and we know that share will be influenced by how many players took that faction – in fact, we’d expect that, in a perfectly balanced environment, each faction’s share of TiWP results would be the same as their player representation, i.e. if half your players were space marine players, you’d expect half of your TiWP results to come from space marine players.
This gives us an easy statistic to look at – we can look at the ratio between the TiWP share and the faction share to get TiWP ratio, a number which will be 1 when the two numbers are the same, and higher or lower as a faction over or underperforms its expectation. This also helpfully lets us control for bad players and a faction’s popularity – Chaos Space Marines are one of the game’s most popular armies, making up 5.7% of the competitive field. They have eight detachments, most of them bad, and there are a ton of players who bring Chaos Space Marines to events with little hope or even intent of starting 4-0. So although their share of TiWP occurrences is 4.8% (above average), that’s less than the 5.7% we’d expect – their TiWP Ratio is only 0.84, suggesting they’re underpowered compared to other factions.
By comparison, the Sisters of Battle make up 4.7% of the field – about one point above the average – but account for an 8.1% share of TiWPs, giving them a TiWP ratio of 1.83. This marks them as one of the game’s best factions (second only to Thousand Sons), and a prime target for a nerf.
Caveats
As with many stats, it’s important to temper your reading of TiWP ratio with the raw totals that go into building it – if a faction has very tiny player base, then any small number of TiWP results may dramatically skew its TiWP ratio, causing massive swings – TiWP Ratio tends to work better with factions whose population percentage is over 2%. On the flip side, we can use this to better understand an army’s dominance – if a faction has a massive population % and is still delivering a high TiWP ratio, then we can safely say it’s absolutely dominant, able to deliver performance far above and beyond despite everyone playing it – something we saw with Necrons and Sisters late in 9th edition.
OverRep
The Stat Check crew use the OverRep statistic for determining whether a faction is outperforming its expectation. This is pretty much the same as TiWP Ratio, only they use share of top 4 appearances at event instead of share of 4-0 starts. This measures roughly the same thing, and the stats are usually in very close alignment. The biggest difference is that there are by definition only ever four top 4 spots at an event regardless of record, while there may be many 4-0 starts, particularly if the event is large enough to require a shadow round. Top 4s is more exclusive, TiWPs more inclusive – neither is necessarily better as a measure, though.
Average First Loss
Another statistic we can look at is First Loss, the average round players of a faction make it to before losing their first game. This helps us understand how often players are winning those early rounds at an event, where pairings are often randomized and high-strength matchups are less likely. Thousand Sons currently lead the pack in first loss with 2.42, suggesting they’re often making it to round 3 before hitting their first loss.
Event Wins (and Win Share)
TiWP and First Loss don’t tell the whole story, either – it’s very possible to have “gatekeeper” factions, which can bully or beat weaker factions and players but typically fail to beat the top factions and players in the top 8/4. These are factions which will typically have a high TiWP ratio but fail to win events. So in addition to looking at TiWP and top 4 appearances, we also want to look at raw event wins. This is another counting stat, and similar to before we can look at share of wins and divide that by population percentage to get an over-representation rate stat as well. In addition to helping us understand whether a faction is merely a gatekeeper, Event wins also helps us understand how a faction does in the hands of the most skilled players – if a small number of players are consistently winning events with a faction despite their broader performance, this will show.
Chaos Space Marines are a great example here – we saw earlier that they’re under-represented with TiWP Ratio, and Stat Checks’ OverRep puts them below as well, with 0.89 OverRep – though having higher OverRep than TiWP already foreshadows where this is going. When we look at event wins since Pariah Nexus dropped, CSM have 15, second only to Adepta Sororitas, giving them a massive 10.1% share of event wins, meaning they show up in the winners’ circle at a rate nearly double what they should be (1.7x, to be precise). Chaos Space Marines as a faction aren’t doing so hot, but certain top players are absolutely crushing it with them, and if we dig deeper we can find one or two specific builds which may be a problem. This is one key way we can dig deeper into a faction’s performance to identify how specific units or lists might be causing issues.
On the other side of things, Grey Knights are over-represented in the top fours and TiWP but have only 3 event wins, marking them as more of a gatekeeper faction – difficult to deal with for some armies, but not able to compete with other top factions (particularly thousand sons, sisters, and – ironically – daemons). They may be a problem if those top factions receive nerfs, and are worth keeping an eye on if they go unchanged.
Detachment Stats
One more thing we can look at are the win rates by Detachment (you can find those on 40kstats here), which helps us to better understand faction performance, since Codex factions have several different detachments and ways to play. This will also help us understand unit imbalance – for Chaos Space Marines only the Chaos Cult Detachment is averaging more than 50% win rate right now (56%), suggesting that might be where to look for nerfs, while the rough performance of all of their other options suggests some buffs for other units may be in order.
Making Predictions
Based on all of that, we can make some predictions for the balance updates coming this week:
- Thousand Sons, Sisters of Battle, and Space Wolves are the most obvious nerf targets – they’ve got high win rates and event wins and are over-represented in the meta no matter how you slice it. I’m personally not looking forward to Rubrics catching a nerf, but if it happens I’ll understand why.
- Chaos Space Marines are low, but doing OK winning events. If we drill into their detachments and lists, we can find a few common culprits, such as Accursed Cultists. Those may be due for a nerf, but we’d hope to see other units see buffs.
- Orks and Genestealer Cults are dying and in need of help. We expect them to see buffs.
- If they’re going extensive, we’d expect to see nerfs on the second tier of factions as well, hitting Black Templars, Astra Militarum, and Dark Angels units that are showing up too often in lists.
Final Thoughts
That wraps up our look at the stats we most often use but there are more out there – head-to-head results, go first win rates, VP scoring, lists analysis – which can help dig even deeper into a faction to understand what’s driving their performance. As always, we’d encourage you to look beyond simple win rates, which just do not tell the whole story, and consider how factors might influence those rates, positively or negatively. There’s a ton of data out there to be mined, and we’ve only scratched the surface.
Have any questions or feedback? Drop us a note in the comments below or email us at contact@goonhammer.com. Want articles like this linked in your inbox every Monday morning? Sign up for our newsletter. And don’t forget that you can support us on Patreon for backer rewards like early video content, Administratum access, an ad-free experience on our website and more.