This week’s Hammer of Math looks at the distribution of effective wounds with Feel No Pain.
The concept of Effective Wounds is one that we’ve discussed frequently in this column, and this week I had an interesting question come up; how distributed are effective wounds? In other words, if a nominal player has 12 wounds and a 4+ Feel No Pain, their effective wounds are 24. What’s the actual distribution?
As a refresher, effective are wounds a metric for showing how resilient a unit is. The formula below reflects the average number of wounds that a model has when you take into account saves (or FNP rolls). For example, with a 4+ FNP roll 50% of the damage will be disregarded and have to be inflicted again. But then 50% of that damage disregarded will be disregarded a second time, and so forth.
Effective Wounds = Wounds * (1/[1 – P(Save)])
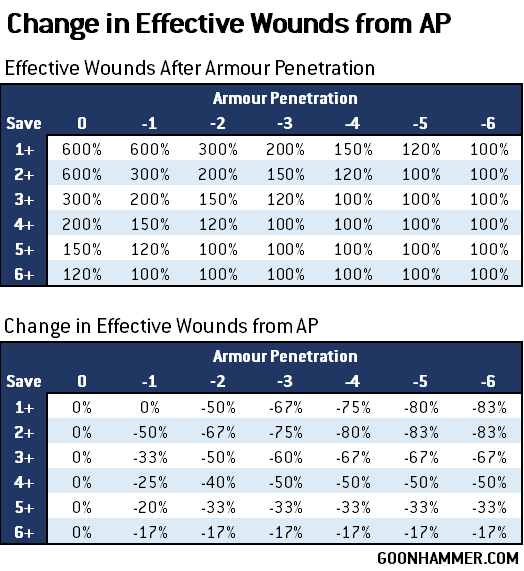 The values for effective wounds for Feel No Pain are identical to those for saves; a 4+ effectively doubles the average number of wounds it takes to kill a target. Note that I said the average; like any dice based game there’s a distribution. This brings up an interesting question; how often would a target have a significantly higher number of effective wounds? In other words if Mortarion has 16 wounds and a 5+ Feel No Pain, what is the probability that he might survive 30 wounds before dying?
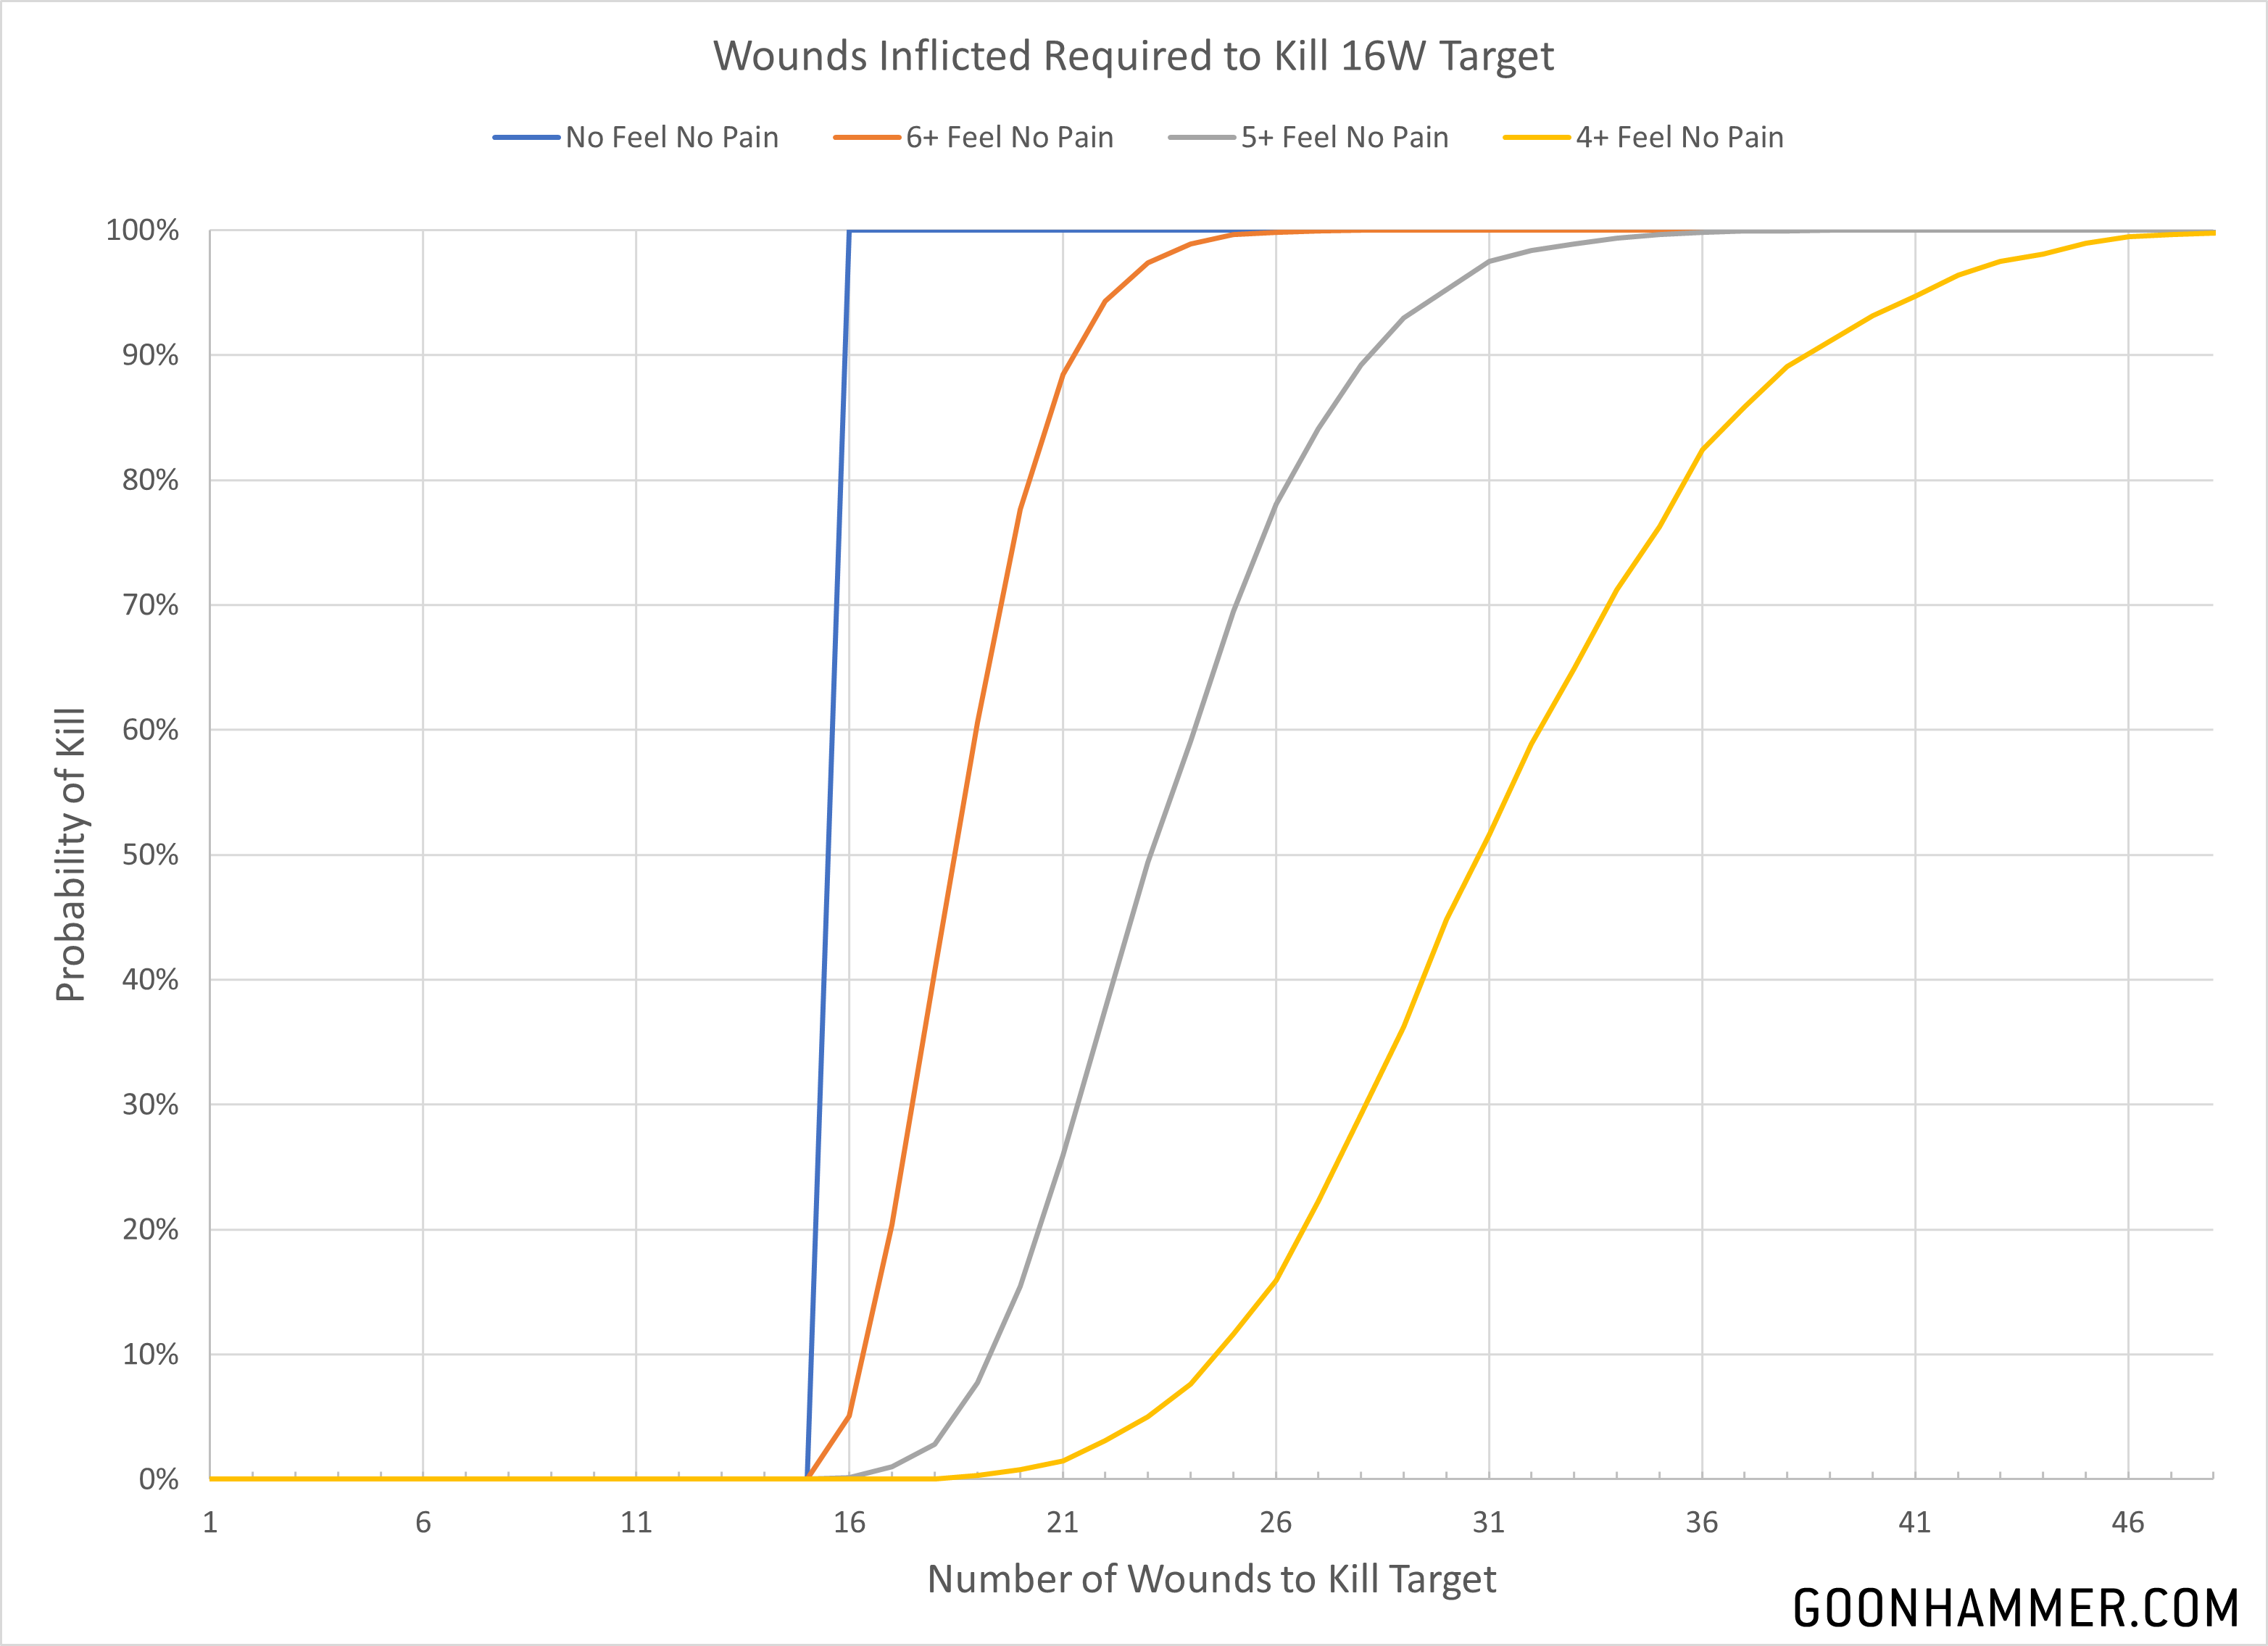
To examine this I did a simple brute force approach; apply 50,000 wounds, see how many saved, and add up how many rolls were required to kill the target for a given number of wounds. The distribution of that data shows us how often a particular value can be found. Charting the results below you see that around 5% of the time Mortarion will survive 30 wounds instead of the expected value of 24. On the other end of the spectrum 3% of the time he’ll only last 18.
When I first looked at the data, I thought that perhaps the results were skewed towards the right side beyond the mean value. This brings about the concept of skewness; the level of asymmetry that a distribution displays. In an ideal world with ideal circumstances we would expect a perfectly symmetrical normal distribution where the mean, median, and mode are all the same. If that distribution is unevenly allocated, with one side having a longer tail than the other, then the data is skewed. There are a couple ways to calculate skew such as by using the mean, median, and standard deviation, and the resulting value will indicate the level of distribution. A positive value means that the data is right-skewed and that the right tail is longer than the left. In the case of the distribution of Mortarion saves with a 5+, the skew was around 0.6 which indicates a moderate skew. The mean and median value of the 5+ data set were both 24, while the mode was 23.
This trend is also true for the other save targets, and the magnitude of the trend correlates with the value. The 6+ FNP curve has a mean of 19.2, a median of 19, a mode of 18, and a skew of 0.70. The 4+ curve had a mean of 31.7, a median and mode of 30, and a skew of 0.40. In other words the better the save, the more normal the distribution. You can see this distribution represented visually in the chart above; the Wounds characteristic of 16 provides a hard floor that cuts off any tails. The further away the mean gets from that cut-off point, the more normal the distribution.
What does this all mean? In simple terms, if Mortarion seems to be surviving everything you throw at him it’s probably not your opponent’s dice. Statistics has just decided to stick you on the wrong tail.
Have any questions or feedback? Drop us a note in the comments below or email us at contact@goonhammer.com. Want articles like this linked in your inbox every Monday morning? Sign up for our newsletter. And don’t forget that you can support us on Patreon for backer rewards like early video content, Administratum access, an ad-free experience on our website and more.